Balance Sheet Deep Dive — Quality of Earnings Link
"Reported profit is an opinion; balance sheet quality and cash flow are where earnings truth is tested."
Learning Objectives
After reading this chapter, you will be able to:
- Explain how balance sheet quality links to ROE and ROCE screening
- Apply debt, working capital, and asset-quality checks on annual reports
- Identify red flags before profitability analysis
- Connect balance sheet deep dive to watchlist construction
Introduction
After reading the balance sheet, the next step is understanding quality of earnings and capital structure — are assets real, is debt sustainable, and is the equity base strong?
This chapter provides a deep-dive checklist that links Balance Sheet items to P&L credibility. A company can show rising PAT while receivables balloon, inventory piles up, or goodwill swells from overpriced acquisitions. The Balance Sheet exposes whether earnings are sustainable or optically inflated.
Core Concepts
Financial Terms
| Term | Meaning |
|---|---|
| Quality of Earnings | Degree to which reported profit converts to cash and persists |
| Accruals | Accounting entries where revenue/expense is recognised before cash moves |
| Working Capital Absorption | Cash tied up in receivables, inventory, and payables |
| Goodwill | Premium paid over fair value in acquisitions — may impair |
| Contingent Liabilities | Potential obligations disclosed in notes, not on face of BS |
| Capital Structure | Mix of debt and equity funding the business |
| Net Debt | Total Debt − Cash and equivalents |
| Interest Coverage | EBIT ÷ Interest Expense — debt service capacity |
Investment Decision
Wealth creation zone:
- ✅ Company quality is good
- ✅ Profit is consistently growing
- ✅ Debt is under control
- ✅ Price is fair
Golden Rule: It is not enough to find good companies; it is not enough to find cheap ones. Multibagger wealth creation starts where quality, growth, controlled debt, and fair price converge.
Earnings Quality Signals
| Signal | Balance Sheet Link | Concern |
|---|---|---|
| PAT ↑, CFO ↓ | Receivables ↑ | Revenue not collected |
| PAT ↑, CFO ↓ | Inventory ↑ | Goods not sold |
| ROE ↑, Equity flat | High leverage | Returns from debt, not operations |
| PAT stable | Goodwill ↑ | Acquisition risk / impairment ahead |
Trap: High ROE alone is misleading if driven by loan leverage rather than operational excellence.
| Company A | Company B | |
|---|---|---|
| Own Capital | ₹100 Cr | ₹50 Cr |
| Loan | ₹0 | ₹500 Cr |
| Profit | ₹20 Cr | ₹20 Cr |
| ROE | 20% | 40% |
Is Company B better? No — huge loan = huge risk.
ROCE is harder to inflate with leverage alone; it shows business strength on total capital employed.
Personal screening: ROE > 15%, ROCE > 15%, low debt → watchlist candidate.
Great homes in the city have fair value ₹1 Cr — if the seller asks ₹3 Cr, the house is nice but the price is wrong. The share market follows the same rule.
Formula & Explanation
Earnings Quality Ratio (Simplified)
Accruals Ratio ≈ (PAT − Operating Cash Flow) ÷ Total AssetsRising accruals over multiple years suggest earnings quality deterioration.
Net Debt
Net Debt = Total Debt − Cash and Cash EquivalentsNet Debt / EBITDA = Leverage relative to operating cash generationInterest Coverage
Interest Coverage = EBIT ÷ Interest ExpenseCoverage < 2× on a sustained basis is a distress warning.
Working Capital Days (Illustrative)
Receivable Days = (Trade Receivables ÷ Revenue) × 365Inventory Days = (Inventory ÷ COGS) × 365Rising days without business explanation → earnings quality concern.
ROE (Context for Deep Dive)
ROE = (Net Profit) ÷ (Shareholders' Equity) × 100Always cross-check ROE with ROCE and debt before trusting headline returns.
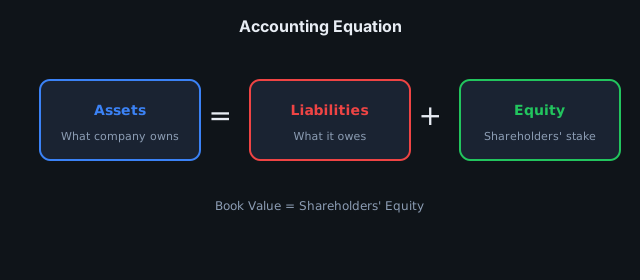
Visual Guide
Worked Example — Indian Market
Net Debt Check
Total Debt ₹800 Cr, Cash ₹200 Cr → Net Debt ₹600 Cr.
Compare Net Debt/EBITDA and interest coverage before trusting a low P/B ratio. A cheap multiple on a leveraged balance sheet is not value — it may be distress.
Receivables vs Revenue (Illustrative)
| Year | Revenue (₹ Cr) | Receivables (₹ Cr) | PAT (₹ Cr) | CFO (₹ Cr) |
|---|---|---|---|---|
| FY22 | 1,000 | 100 | 80 | 75 |
| FY24 | 1,400 | 220 | 95 | 40 |
PAT grew but CFO collapsed while receivables surged → earnings quality red flag.
Real World Example
You and a friend start a shop together with ₹10 lakhs each. After one year, profit is ₹2 lakhs — return = 2 ÷ 10 × 100 = 20% ROE.
But if half your "sales" are on credit and customers are not paying, your cash box is empty despite strong "profit." The Balance Sheet (receivables) reveals the earnings quality gap.
"Is this company really making good money for its owners?"
Profitability analysis asks: How much is the company making relative to the capital invested? The deep dive asks: Is that profit real and repeatable?
Case Study
Company A: P/E = 5, profit declining — cheap on ratio, risky on fundamentals and balance sheet quality.
Company B: P/E = 20, profit growing 25%/year, strong CFO, controlled receivables — often the better investment despite a higher multiple.
ICICI Bank vs TCS: Sector norms differ — compare P/E within the same industry, not across sectors blindly.
BEL / HAL: Defence order books can inflate receivables — always read notes on government payment terms and link to Cash Flow Statement.
CFA Exam Tip
10-Minute Framework — any share:
- How much debt?
- How much cash?
- What is ROE?
- What is ROCE?
- Is profit increasing with cash support?
- Is valuation reasonable?
- Would I want to be a long-term partner in this business?
If "Yes" → deeper research. Graham Number alone is insufficient — ROE, ROCE, debt, growth, and earnings quality must all be verified.
Common Mistakes
- ROE high solely due to excessive debt
- ROE >> ROCE persistently
- Low P/E with falling profits and weak cash conversion
- Paying premium with no growth/quality support
- No Margin of Safety
- "Good company" narrative without valuation or earnings quality check
- Ignoring notes to accounts (contingent liabilities, related-party transactions)
Key Takeaways
- Balance sheet deep dive is the critical filter before trusting profitability ratios.
- ROE reflects owners' return; ROCE reflects total deployed capital — both are essential to avoid leverage traps.
- Earnings quality links P&L to Balance Sheet via receivables, inventory, accruals, and cash flow.
- Valuation ensures you do not overpay for quality — P/E, Graham Number, and Margin of Safety are key tools.
- A 10-minute checklist + partner mindset = practical analyst workflow before deep dive.
Practice Questions
Chapter: Balance Sheet Deep Dive | Part 02 | Try before reading answers.
Q1 (Conceptual): What is the core message of this chapter in one sentence?
Q2 (Calculate): Fair value ₹1 Cr, buy at ₹70 lakh — Margin of Safety?
Q3 (Application): PAT ↑ 20%, CFO ↓ 30%, receivables ↑ 80% — what does it imply?
Q4 (Red Flag): ROE high solely due to excessive debt — why avoid relying on ROE alone?
Q5 (CFA Style): What is a CFA-style trap when interpreting balance sheet deep dive?
Q6 (Decision): Fundamentals look strong but valuation is stretched — invest, wait, or avoid?
Q7 (Lab): Complete one Balance Sheet Deep Dive exercise in Part 02 Practice Lab.
Answer Key
Q1 (Conceptual)
Balance sheet quality determines whether reported earnings are real, sustainable, and worth the price you pay.
Q2 (Calculate)
30%
Q3 (Application)
Earnings quality concern — profit may not convert to cash; investigate revenue recognition and collections.
Q4 (Red Flag)
Leverage inflates ROE — operational returns may be weak; downturn risk is high.
Q5 (CFA Style)
Trusting PAT trend without CFO triangulation and working capital analysis.
Q6 (Decision)
Usually wait for margin of safety unless quality is exceptional. Earnings quality and valuation must align.
Q7 (Lab)
See Part 02 Practice Lab and verify with lab Answer Key.
Go deeper: Part 02 Practice Lab
FAQ {#faq}
Q: After reading the Balance Sheet, what should I check second?
A: Cash Flow Statement — triangulate PAT with CFO; persistent gaps signal earnings quality issues.
Q: ROE >> ROCE persistently — action?
A: Deep-dive debt, interest coverage, and DuPont — leverage is likely masking weak operations.
Q: How do I connect theory to Indian market practice?
A: Use Screener/Trendlyne + company annual reports — plot the same metrics over 3 years; paper formulas alone are insufficient.
Q: Low P/E with falling profits — why avoid?
A: Classic value trap — cheap multiple on shrinking, low-quality earnings.
Q: How do I drill these concepts in the Practice Lab?
A: Open Part 02 Practice Lab → use the FAQ Drill row for balance-sheet-deep-dive to practice on real stocks, then verify answers against the Chapter FAQ Quick Index.
Practice Lab FAQ: Full part FAQ index — Part 02 Practice Lab
Related Topics
- Previous Chapter: 09-Balance Sheet Profitability
- Next Chapter: 11-Graham Number Intro
- Part Overview: Part 02 Financial Statements
- Book Index: Full Table of Contents
Disclaimer: Educational content only. Not investment advice. Consult a qualified financial advisor before investing.