Profit & Loss Statement — Margin Stack and Earnings Quality
"Revenue starts the story, but profit decides whether the story succeeds."
Learning Objectives
After reading this chapter, you will be able to:
- Read a P&L from Revenue through COGS, EBITDA, and PAT
- Build a margin stack and interpret gross vs operating profitability
- Flag red flags: revenue growth without profit growth, profit without cash flow
- Link P&L lines to Balance Sheet and Cash Flow Statement (three-statement view)
Introduction
Every business exists to generate sustained and growing profits. In Chapter 4 you learned that a share represents ownership in a business. The next logical question is: Is this business really making money?
The answer lies in the Profit & Loss Statement (P&L / Income Statement) — the most important chapter in a company's financial story. Equity research analysts typically open the annual report and read the P&L first.
The P&L shows how much the company earned over a period (usually one financial year). It is not a snapshot like the Balance Sheet; it is a performance report — revenue in, costs out, profit left.
Core Concepts
Financial Terms
| Term | Meaning |
|---|---|
| Revenue / Sales | Total income from selling products or services |
| Operating Expenses | Costs incurred to generate revenue |
| EBITDA | Earnings Before Interest, Tax, Depreciation, and Amortization |
| Depreciation | Non-cash charge reflecting reduction in asset value |
| EBIT | Earnings Before Interest and Tax |
| PBT | Profit Before Tax |
| PAT | Profit After Tax — profit attributable to shareholders |
| EPS | Earnings Per Share = PAT ÷ Total Outstanding Shares |
| EBITDA Margin | EBITDA ÷ Revenue |
| Net Profit Margin | PAT ÷ Revenue |
| Effective Tax Rate | Tax ÷ PBT |
| One-Time Gains | Non-recurring profit items (asset sale, tax reversal) |
Investment Decision
Do not get excited by sales alone — analyse profit quality before you invest.
Decision Framework:
- Calculate 5-year Revenue CAGR
- Calculate 5-year PAT CAGR
- Check EBITDA margin trend
- Track EPS growth
- Scan for red flags
- Identify the company with the strongest earnings quality
Practice: BEL, HAL, ICICI Bank, Nile, POEL — pull 5-year Revenue, PAT, and EBITDA margin from annual reports.
Disclaimer: A single-year P&L snapshot is insufficient — always analyse multi-year trends and cross-validate with the Balance Sheet and Cash Flow Statement.
Revenue Growth Benchmarks
| Level | Growth |
|---|---|
| Good | >10% |
| Strong | >15% |
| Exceptional | >20% |
Profit Growth Benchmarks
| Level | Growth |
|---|---|
| Average | <10% |
| Good | 10–15% |
| Strong | 15–20% |
| Exceptional | >20% |
Margin Types
| Margin | Indicates |
|---|---|
| Gross Margin | Production efficiency and pricing power |
| EBITDA Margin | Operational efficiency |
| Net Profit Margin | Bottom-line profitability |
Hands-on drill:
- Open annual reports for BEL, HAL, ICICI Bank, Nile, and POEL
- Record 5-year Revenue and PAT
- Calculate Revenue CAGR and Profit CAGR
- Analyse EBITDA margin trend
- Identify the company with the strongest earnings quality
Formula & Explanation
P&L Waterfall
Revenue
− Operating Expenses = EBITDA
− Depreciation = EBIT
− Interest = PBT
− Tax = PAT
Key Ratios
EBITDA Margin = (EBITDA) ÷ (Revenue) × 100Net Profit Margin = (PAT) ÷ (Revenue) × 100EPS = (PAT) ÷ (Total Outstanding Shares)Effective Tax Rate = (Tax) ÷ (PBT)Margin Comparison — Same Revenue, Different Efficiency
| Company | Revenue | EBITDA | EBITDA Margin |
|---|---|---|---|
| A | ₹100 Cr | ₹20 Cr | 20% |
| B | ₹100 Cr | ₹10 Cr | 10% |
Company A is more operationally efficient.
Revenue vs PAT — Quality Matters
| Company | Revenue | PAT | Net Margin |
|---|---|---|---|
| A | ₹1,000 Cr | ₹10 Cr | 1% |
| B | ₹200 Cr | ₹40 Cr | 20% |
Company B is potentially far more attractive despite lower revenue.
Visual Guide
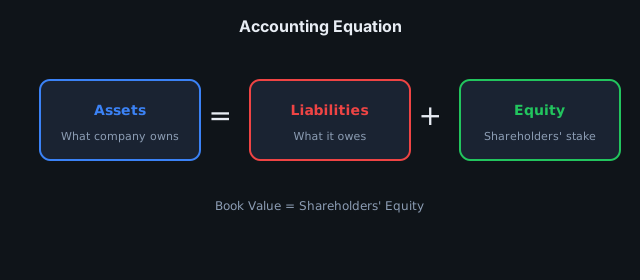
The P&L feeds net profit into equity on the Balance Sheet and must reconcile with cash flow from operations.
Worked Example — Indian Market
Deep Walkthrough: P&L Margin Stack (FMCG-style)
| Line | ₹ Cr | % Rev |
|---|---|---|
| Revenue | 50,000 | 100% |
| COGS | 22,000 | 44% |
| Gross Profit | 28,000 | 56% |
| Opex | 12,000 | 24% |
| EBITDA | 16,000 | 32% |
| Depreciation | 2,000 | 4% |
| PAT | 10,500 | 21% |
Track gross margin stability (pricing power) and EBITDA expansion (operating leverage). A company that holds gross margin while scaling revenue often has a durable competitive advantage.
Real World Example
An LED bulb company sells 10 lakh bulbs in a year at an average price of ₹100 per bulb:
Revenue = 10,00,000 × ₹100 = ₹10 CrRevenue may look impressive, but if costs are ₹9.5 Cr, PAT is only ₹50 lakh. Revenue does not make a company rich; profit does. High top-line growth with thin margins is a common trap for retail investors who chase "hot" sectors without reading the P&L.
Case Study
When an analyst reviews BEL (Bharat Electronics), key P&L questions include:
- What is the revenue growth rate?
- Is EBITDA margin stable?
- Is PAT growth outpacing revenue growth?
- Does the order book support future revenue?
Apply the same framework to HAL, ICICI Bank, Nile, and POEL. Defence and PSU names often show lumpy revenue; banks require sector-specific line items (NII, provisions) rather than a generic manufacturing P&L.
Dividend link (Chapter 2): Coal India, PFC, and REC — PAT quality directly determines dividend capacity. A company can show revenue growth but cut dividends if margins compress or cash conversion weakens.
CFA Exam Tip
P&L Research Checklist:
✅ Revenue Growth → ✅ EBITDA Margin → ✅ EBIT Trend → ✅ Interest Cost → ✅ PAT Growth → ✅ EPS Growth → ✅ Margin Expansion
Key insights:
- Revenue growth without profit growth = red flag (buying growth at any cost)
- Profit growth without cash flow = earnings quality concern (cross-check Cash Flow Statement)
- Rising interest cost = balance sheet stress signal
- Sudden tax rate change = investigate the reason
- Markets reward earnings growth over the long term — EPS trajectory matters most
Depreciation note: Depreciation is a non-cash charge — it reduces accounting profit but not necessarily cash. For capital-intensive businesses, EBITDA is often more informative than PAT alone.
Common Mistakes
- Revenue ↑ but profit flat or ↓
- Profit ↑ but cash flow ↓
- Margins consistently compressing
- Interest cost rapidly rising
- Profit boosted by one-time gains
- Effective tax rate changing without explanation
- Revenue growth via aggressive credit (receivables surge — cross-check Balance Sheet)
Key Takeaways
- The P&L tells the income and profit story of a business.
- Revenue is the business oxygen; without growth, profit potential is limited.
- EBITDA is a key indicator of operating performance.
- PAT is shareholders' actual profit; EPS is derived from PAT.
- Profit quality matters more than revenue size.
- Margin trends often signal future direction.
- High interest cost is a warning of debt stress.
Practice Questions
Chapter: Profit And Loss Statement | Part 02 | Try before reading answers.
Q1 (Calculate): Revenue ₹1,000 Cr, PAT ₹110 Cr — Net margin?
Q2 (Trend): Revenue ↑ 20% but PAT flat — red flag?
Q3 (Application): PAT ↑ but CFO ↓ — what to check?
Q4 (Red Flag): Profit boosted by one-time gain?
Q5 (CFA Style): Depreciation is non-cash — PAT vs EBITDA?
Q6 (Lab): Part 02 Practice Lab margin stack drill.
Answer Key
Q1 (Calculate)
11%
Q2 (Trend)
Yes — margin compression or cost inflation; investigate EBITDA
Q3 (Application)
Receivables, inventory, working capital quality
Q4 (Red Flag)
Normalize PAT; trend misleading
Q5 (CFA Style)
Capital-intensive firms: EBITDA often better operating view
Q6 (Lab)
Go deeper: Part 02 Practice Lab
FAQ {#faq}
Q: Revenue growth without PAT growth — red flag?
A: Yes — margin compression, cost inflation, or buying revenue at any cost; investigate the EBITDA trend.
Q: PAT up but cash flow down — next step?
A: Cross-check Balance Sheet and Cash Flow Statement: receivables, inventory, and working capital absorption.
Q: EBITDA vs PAT — capital-intensive business?
A: Heavy depreciation depresses PAT but EBITDA shows operating cash generation potential; use both.
Q: One-time gain boosts PAT — how to adjust?
A: Normalize PAT excluding extraordinary items; run trend analysis on adjusted earnings only.
Q: How do I drill these concepts in the Practice Lab?
A: Open Part 02 Practice Lab → use the FAQ Drill row for profit-and-loss-statement to practice on real stocks, then verify answers against the Chapter FAQ Quick Index.
Practice Lab FAQ: Full part FAQ index — Part 02 Practice Lab
Related Topics
- Previous Chapter: 05-Market Cap Enterprise Value
- Next Chapter: 07-Balance Sheet Intro
- Part Overview: Part 02 Financial Statements
- Book Index: Full Table of Contents
Disclaimer: Educational content only. Not investment advice. Consult a qualified financial advisor before investing.